
Essentials for YOOtheme Pro
Chart Element
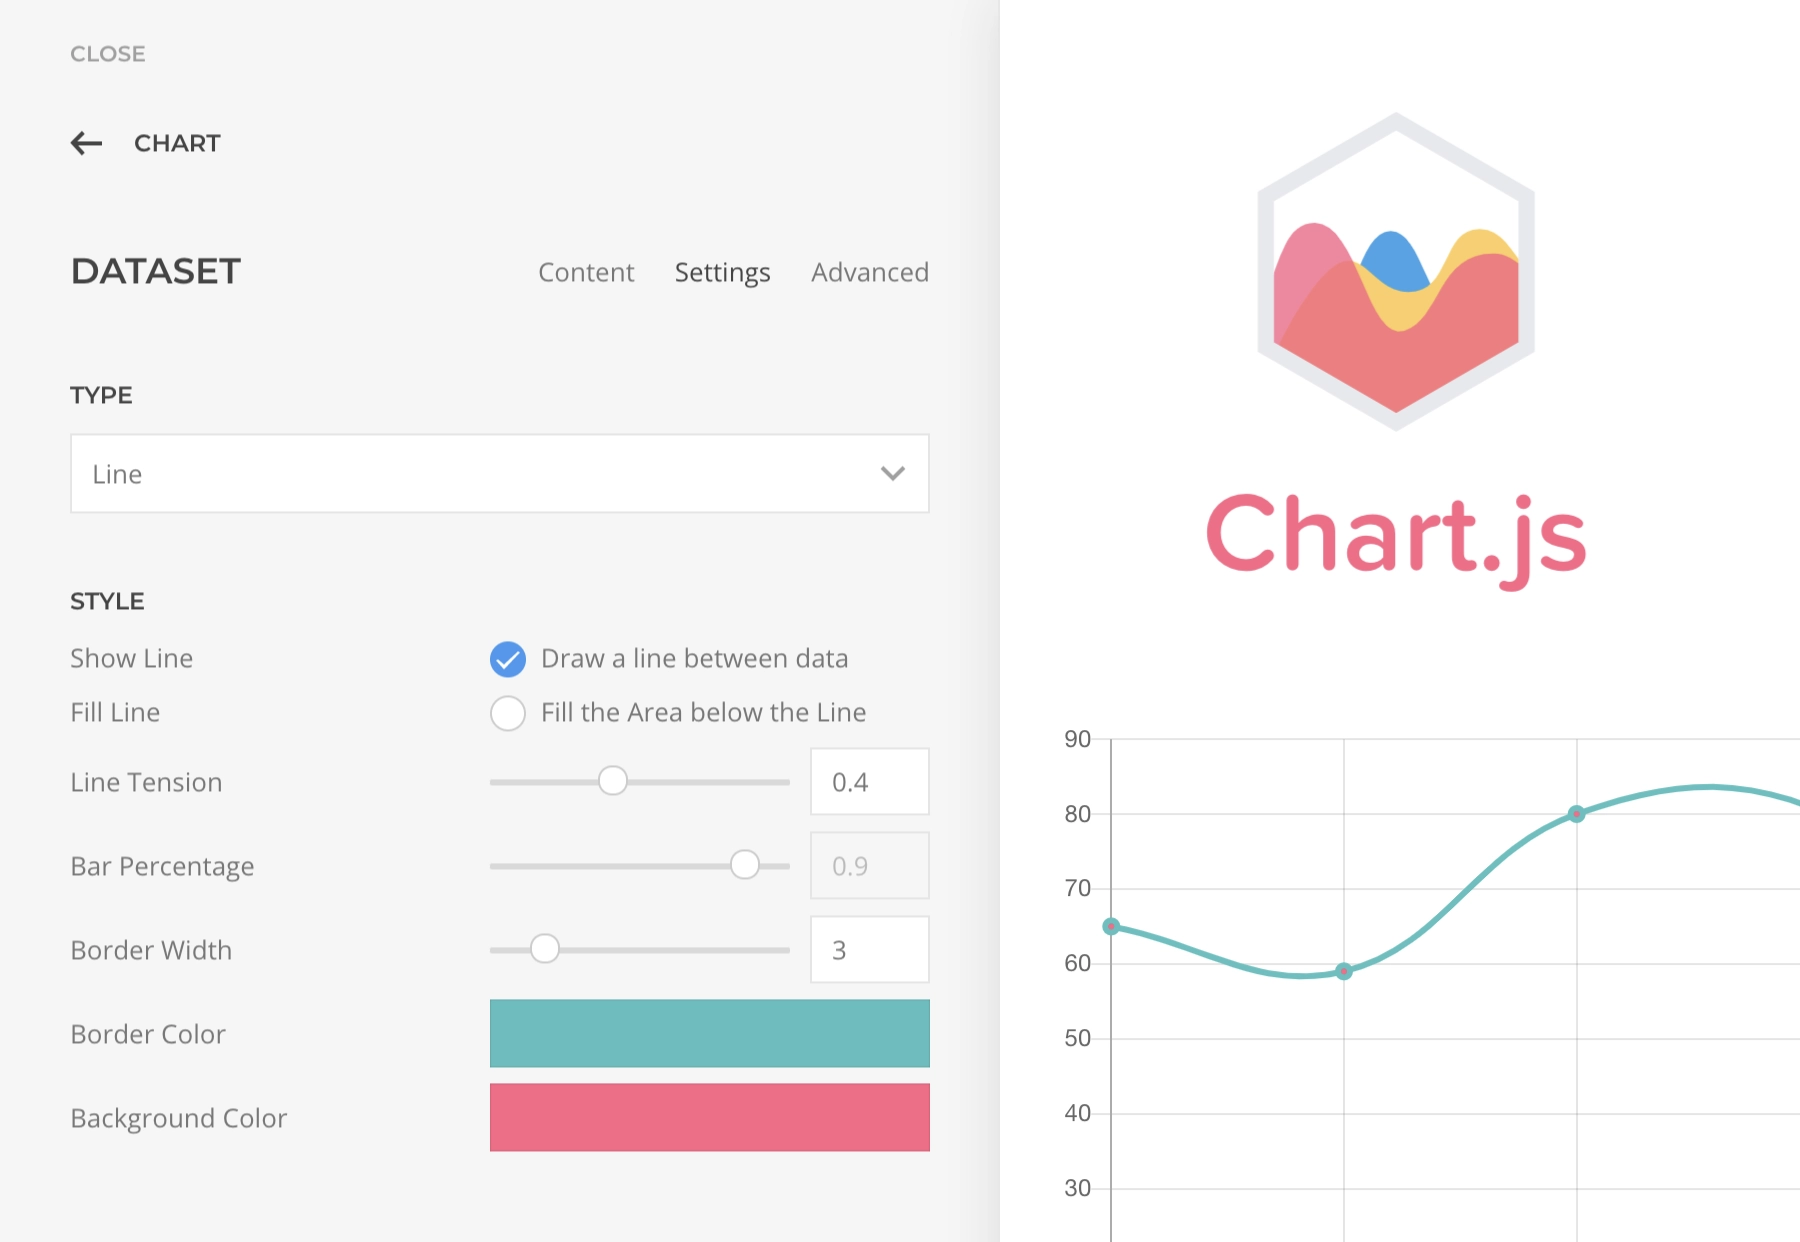
A chart element based on Chart.js.
The Chart Element allows you to display static and dynamic data using visually appealing charts and graphs based on the popular JavaScript library Chart.js v4.3.0.
Variety of chart types are supported, including Line, Vertical Bar, Horizontal Bar, Radar, Pie, Doughnut, Polar Area, Bubble, and Scatter. You can also customize the appearance of your charts using a range of options and settings.
How to enable Elements Addon
Open the Customizer -> Essentials -> Advanced panel and spot the Elements Addon checkbox. If is off, enable it, save the changes and refresh the page.
Quick Start
Setting up a Dynamic Chart can be somewhat overwhelming, for an easier start you can download this combo of a Section plus CSV Data and then do this simple setup:
- Download preset and unzip.
- Create a new CSV Source based on the csv file.
- Open the builder, import the layout and render it content.
- In the Chart element open the first Dataset, then again open its Data Item.
- In the Advanced Tab of the item choose the previously created source as its Dynamic Content.
Sources Addon Required
Notice that this preset is dependent on the premium Dynamic Addon for the CSV data source creation.